

Post-Processor
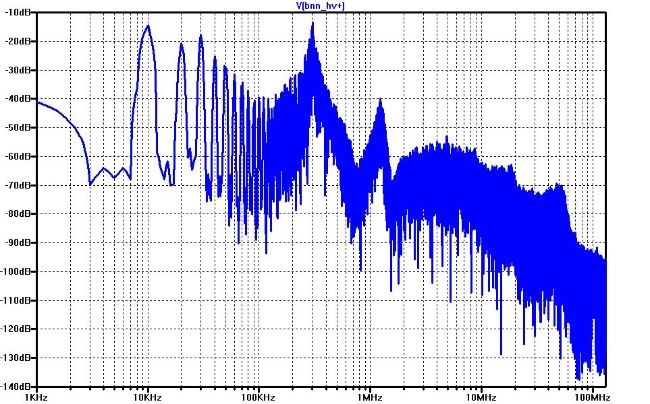


Data from the Simulator
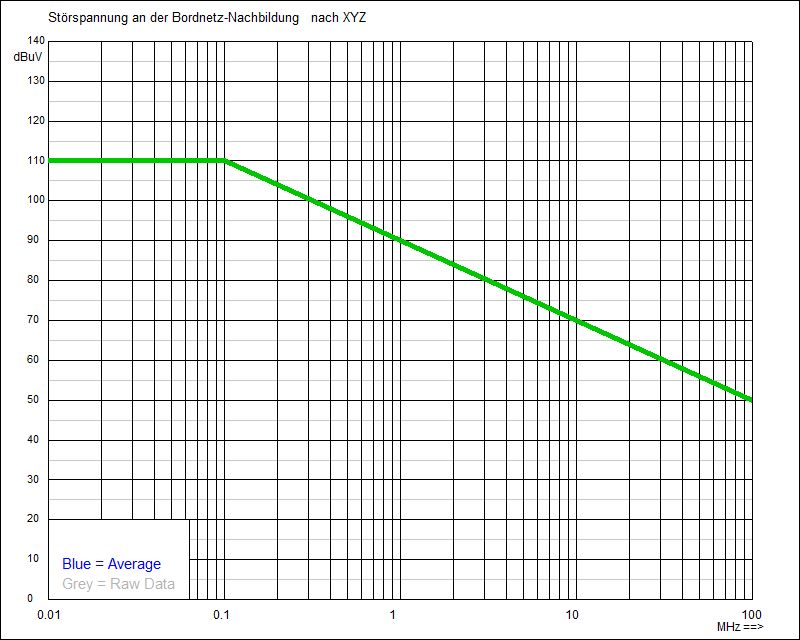
Diagram-Template with Limits
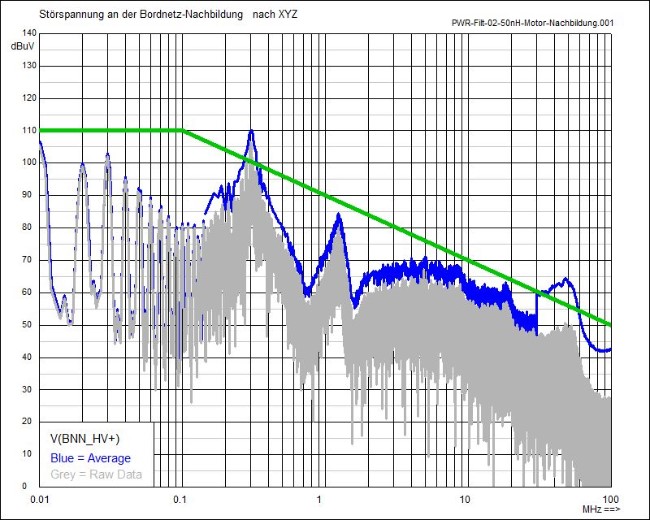
Transferred Customer-Diagram
with Bandwidth-Weighing
The Post-Processor extracts the data from the simulator program (LTspice or Simplorer) and transfers it to the diagram templates with the limit curves.
Not only a conversion into the coordinates of the customer diagrams takes place (gray curve), but also an evaluation according to the bandwidth of an EMI-receiver or analyzer (blue curve). This can be clearly recognized by the level jump of the blue curve at 150 kHz and 30 MHz. Below 150 kHz, the weighted curve practically follows the original LTspice spectrum, as there are no significant summations within the evaluation bandwidth of 200 Hz.
The great advantages of the Post-Processor can be recognized especially well in Spread-Spectrum-Modulation.
Without the Bandwidth-Weighing by the Post-Processor one could very easily draw wrong conclusions here.
Of course we use the original limits of our customers in accordance with the standards applied or according to specifications. However, these can not be shown here because they are protected by copyright or by non-disclosure agreements.
© Ingenieurbüro Lindenberger 8447